Scrum projects work better when the produced quality is high and with safeguards to keep it high. So automated testing is key. Luckily, many good and free tools are out there. I find that often performance testing is poorly understood or is thought of as some sort of mystical art. In this post I show you how to do basic performance testing with Apache JMeter which you can adapt for your projects.
Say you make a new shiny website. Usually you want to know how many concurrent users the site can handle. Performance tests have 2 parts:
- Performance test: what’s the timing of a single request?
- Load test: how does the system hold under an expected load of requests?
Think of your Test Plan
The most important part is often skipped: before you start hitting the server think about what you want to test and how to do that:
- Think about a typical scenario that your users follow (this can be “A user will login, search, select a item, read it, download the attachment and log out”)
- How many users do you expect at peak time?
- What do you consider as acceptable wait time?
- Do we test agains the right hardware/software configuration? You do not want to test against the developers workstations if your production site will run on a big cluster of high grade hardware.
Install and run JMeter
Apache JMeter is powerful and free software to perform these tests. Because it is so powerful the many options can distract you, but if you follow this guide you quickly get the hang of it. It’s freely downloadable from JMeter website. Choose a mirror and download the latest release, maybe apache-jmeter-2.11.zip
Windows users should unzip and make sure java bin is in the PATH and JAVA_HOME is set. You could add it to env vars or type the following in a CMD window:
set PATH=%PATH%;”C:\Program Files (x86)\Java\jre7\bin\”
Then run JMeter:
> cd …path-to/apache-jmeter-<2.8>/bin
> jmeter.bat
The program looks like this: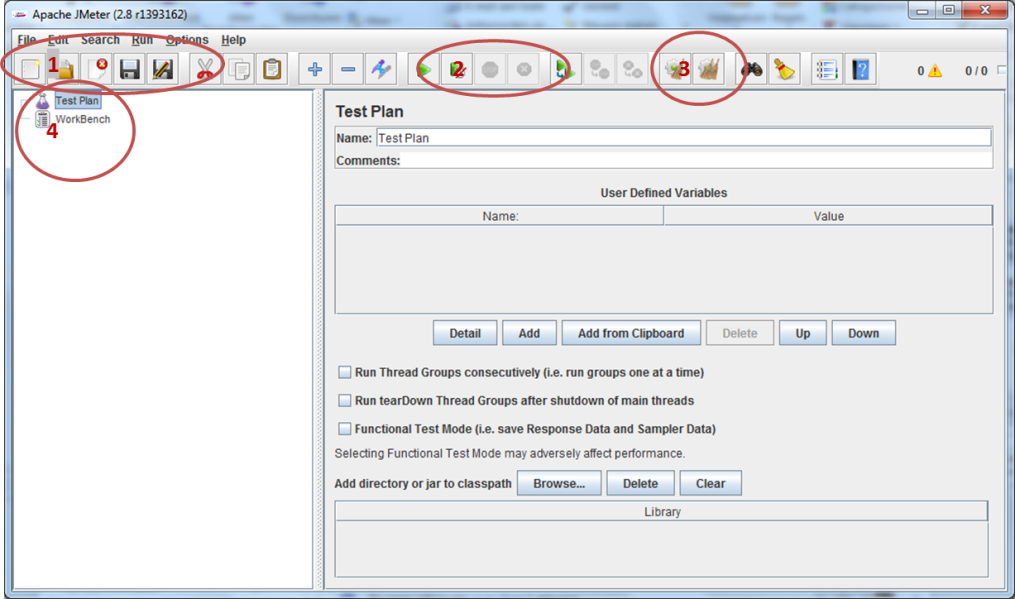
In the picture i listed the main functions we are going to use:
- Functions to save, open scripts
- Play functions
- Clean previous results
- Current Test Plans
Building our Test Script
In JMeter we build and execute a script, the Test Plan. Simulated users are a thread, hence multiple simulated user-calls are in a “Thread Group“.
We start with making such a group: right-click on Test Plan > Add > Threads (Users) > Thread Group
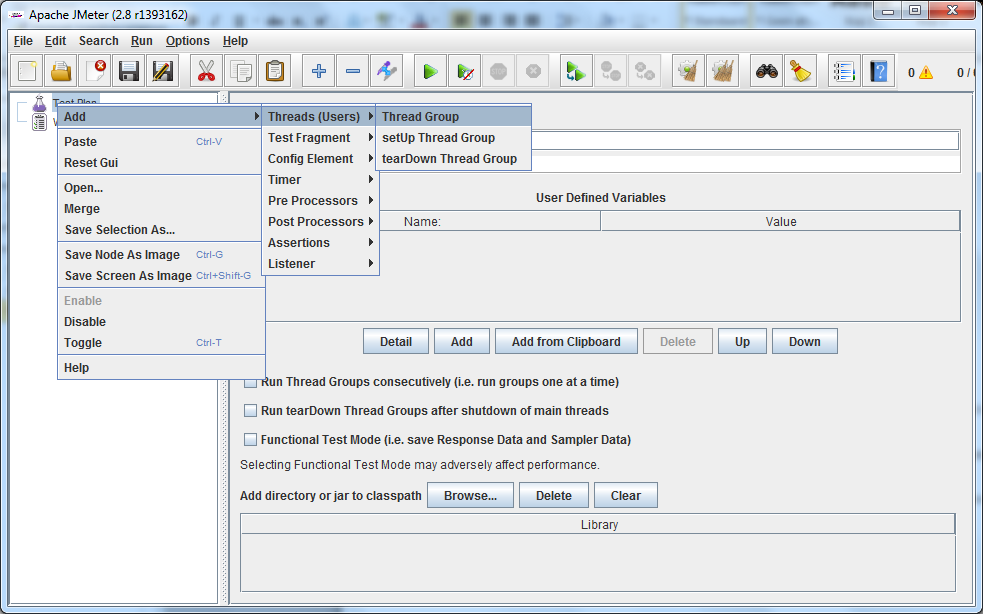
For the example here we make a testscript to open the homepage of google.
First some housekeeping:
- Rename the Test Plan to something useful: “Check Google homepage“
- Rename the standard “Thread Group” to a meaningful name such as “open homepage”.
Usually you’ll want to simulate a browser. For that JMeter has some very handy standard configurable tools. Add to the Thread Group “config elements”
- Add a HTTP Cache Manager
- Add a HTTP Cookie Manager
- To help yourself later on, add a HTTP Request Default config element: it will keep default configuration settings for all later requests so that we only have to set them once:Webserver: Servername www.google.nl, Timeout: connect to 5000, response to 10000 ms
- Like in a real browser we want to download related content such as images, JS and CSS files. For this check Optional tasks > retrieve all embedded content from HTML files and put: concurrent pool: 5 threads
To really send those HTTP requests we add Samplers. Take a look at all the cool samplers you have and be insprired for your next testing project 😀 Now add a HTTP Request with the following configuration:
- Path: / (Here comes the HTTP Request Default in handy)
- Follow Redirects: Aan
- Use KeepAlive: Aan
- BrowserCompatible Headers: Aan
Now we have the HTTP requests sent out, but to see what happens with a request we need to add Listeners. These aggregate the results in reports, charts, etc. Try different ones you like, you can add multiple in 1 Thread Group. For now:
- Add a View Results Tree; this is a tree view with every request, especially useful to check the result of samples and debug your setup.
- Also add a Graph Results. This will show a graph of every sample which enables you to see trends.
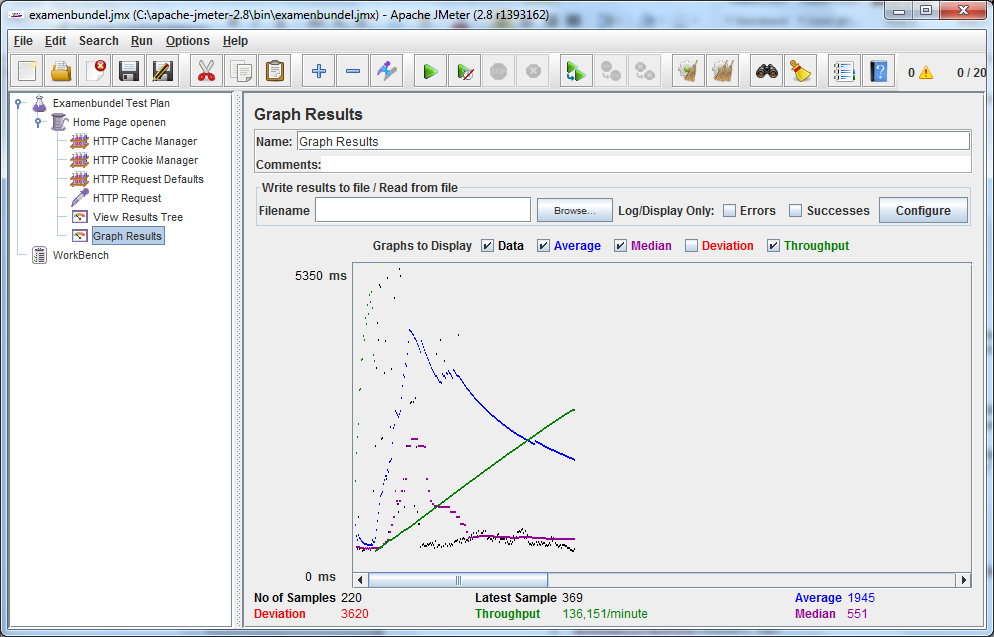
Testing
First dry run your script with a single run. In properties of Thread Group we called “Home Page” put 3 settings:
- Number of Threads (users) – How many concurrent users will visit the page. This can be 20
- Ramp-Up Period – Over which period the users are making the request calls. If you put 2: during 2 seconds the 20 requests are fired
- Loop Count – How many times do you repeat this routine
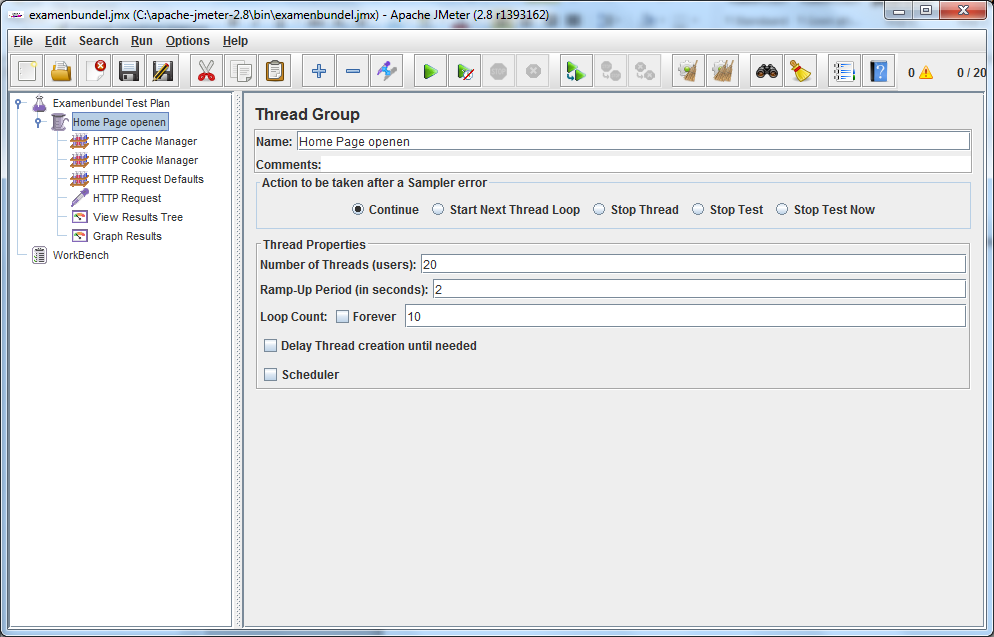 In your first run you’ll want to put it all to 1. Press play and see what the result is in the View Tree Results. Also look into the response, you may be surprised that the page is different than you expected (not the homepage but who knows a “Bad Proxy Gateway” page) and then you’re not really testing what you want.
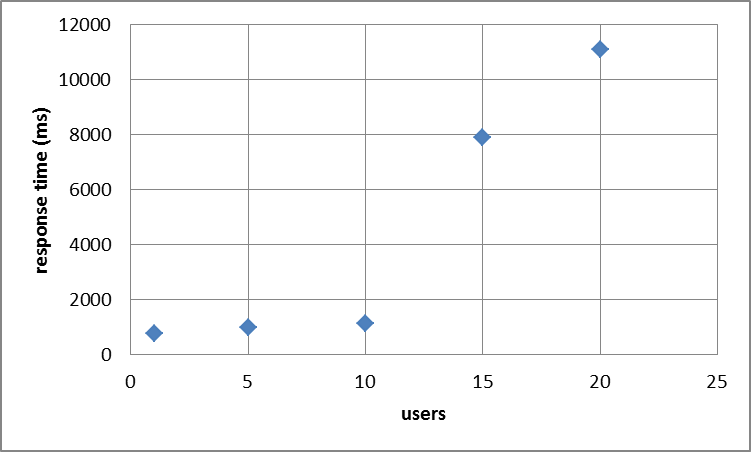
If all is well we can start the real testing. Think of how many users the site should be handling and how that translates to concurrent users. Add more and more users and keep the results. I usually make runs while increasing the number of users with 5. Between runs it is best to delete results so the average is easier to read. See this table below for a real run:
|
Users |
Avg. response time |
Timeouts |
|
|
1 |
2 |
764 |
|
|
5 |
2 |
970 |
|
|
10 |
2 |
1134 |
|
|
15 |
2 |
7895 |
1 |
|
20 |
2 |
11092 |
1 |
You’ll see a sharp increase in response times; this is the saturation point of the complete server setup. In this case it lies between 10 and 15 concurrent users. In a chart it’s even more obvious:
This is it. Easy wasn’t it? Drop me a line if you find this useful, have comments or other tips for automated testing.
Happy performance testing!
